> ## Documentation Index
> Fetch the complete documentation index at: https://gcore-doc-1256a.mintlify.site/llms.txt
> Use this file to discover all available pages before exploring further.
# View CDN statistics in Grafana
With the Gcore cdn-stats plugin in Grafana, you can display the CDN statistics by:
* **Total Traffic,** which is total traffic volume, consisting of traffic from origin to CDN or [Shielding](/cdn/cdn-resource-options/general/enable-and-configure-origin-shielding) + from [Shielding](/cdn/cdn-resource-options/general/enable-and-configure-origin-shielding) to CDN + from CDN to users;
* **Byte cache Hit Ratio,** which is the share of cached traffic, calculated using the formula: 1-(traffic from the origin to the CDN or [Shielding](/cdn/cdn-resource-options/general/enable-and-configure-origin-shielding)/traffic from the CDN to users);
* **Edges Traffic,** which is traffic from CDN, consisting of traffic from [Shielding](/cdn/cdn-resource-options/general/enable-and-configure-origin-shielding) to CDN + from CDN to users;
* **Shield Traffic,** which is traffic from [Shielding](/cdn/cdn-resource-options/general/enable-and-configure-origin-shielding) to CDN;
* **Origin Traffic,** which is traffic from the origin, consisting of traffic from the origin to the CDN or from the origin to the [Shielding](/cdn/cdn-resource-options/general/enable-and-configure-origin-shielding);
* **Total Requests,** which is the number of requests to the CDN;
* **2xx, 3xx, 4xx, 5xx Responses,** which is the number of 2xx, 3xx, 4xx, and 5xx responses;
* **Bandwidth,** which is bandwidth, calculated based on traffic from the origin to the CDN or [Shielding](/cdn/cdn-resource-options/general/enable-and-configure-origin-shielding) + from [Shielding](/cdn/cdn-resource-options/general/enable-and-configure-origin-shielding) to CDN + from CDN to users;
* **Cache Hit Ratio,** which is the share of sending cached content, consisting of responses with cached content / requests to CDN;
* **Shield traffic ratio** is the efficiency of the [Shielding](/cdn/cdn-resource-options/general/enable-and-configure-origin-shielding): how much more traffic is sent from the [Shielding](/cdn/cdn-resource-options/general/enable-and-configure-origin-shielding) than from the origin, calculated using the formula: (traffic from the [Shielding](/cdn/cdn-resource-options/general/enable-and-configure-origin-shielding) to the CDN - traffic from the origin to the [Shielding](/cdn/cdn-resource-options/general/enable-and-configure-origin-shielding)) / traffic from the [Shielding](/cdn/cdn-resource-options/general/enable-and-configure-origin-shielding) to the CDN;
You can group metrics by the following parameters:
* **Clients** is for clients;
* **Resource** is for CDN resources;
* **Region** is for regions;
* **Country** is for countries;
* **Data** is for data centers;
* **Vhost** is for a personal domain.
**Note** : The plugin is designed for Grafana version 7.0 and higher.
To configure CDN statistics in Grafana, you need to:
* Use Grafana version 7.0 and higher.
Video instructions of the steps:
## Download and install the plugin
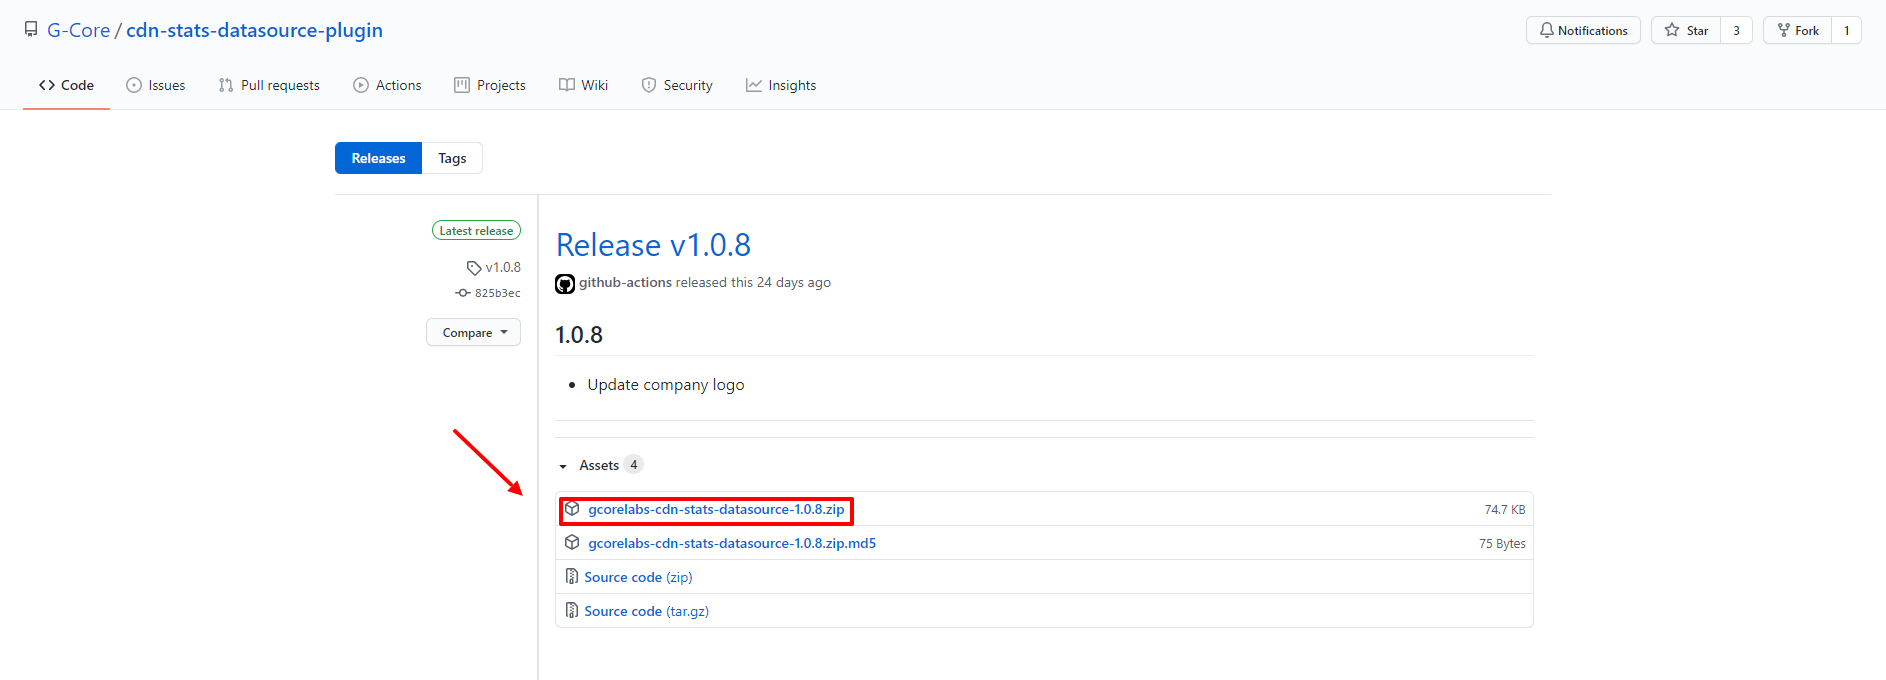
[Download](https://github.com/G-Core/cdn-stats-datasource-plugin/releases) the gcore-cdn-stats-datasource-1.0.8.zip file with the latest version of the plugin in GitHub.
**Note** : The numbers (1.0.8) in the file name indicate the plugin version and may differ depending on updates.
Unzip the archive to the Grafana plugin folder. By default, this is the *Grafana\grafana\data\plugins* installation folder.
[Restart](https://grafana.com/docs/grafana/latest/installation/restart-grafana) and [log](https://grafana.com/docs/grafana/latest/fundamentals/getting-started/first-dashboards/) in to Grafana.
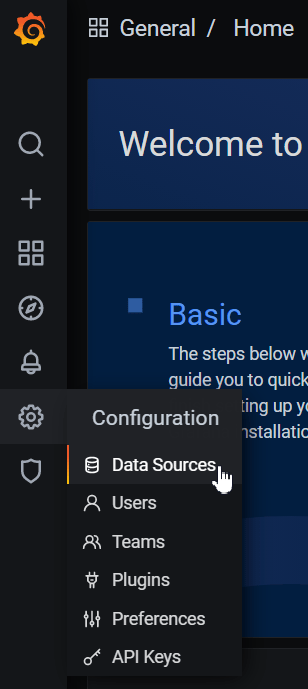
Click the gear icon in the menu to open the "Configuration" section, select "Data Sources".
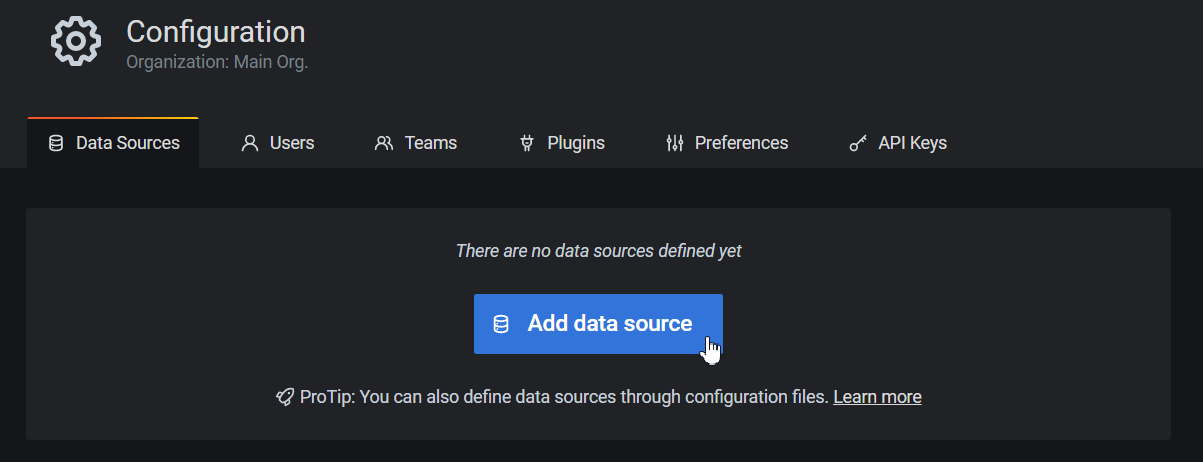
Click **Add data source** to add a new resource for getting data.
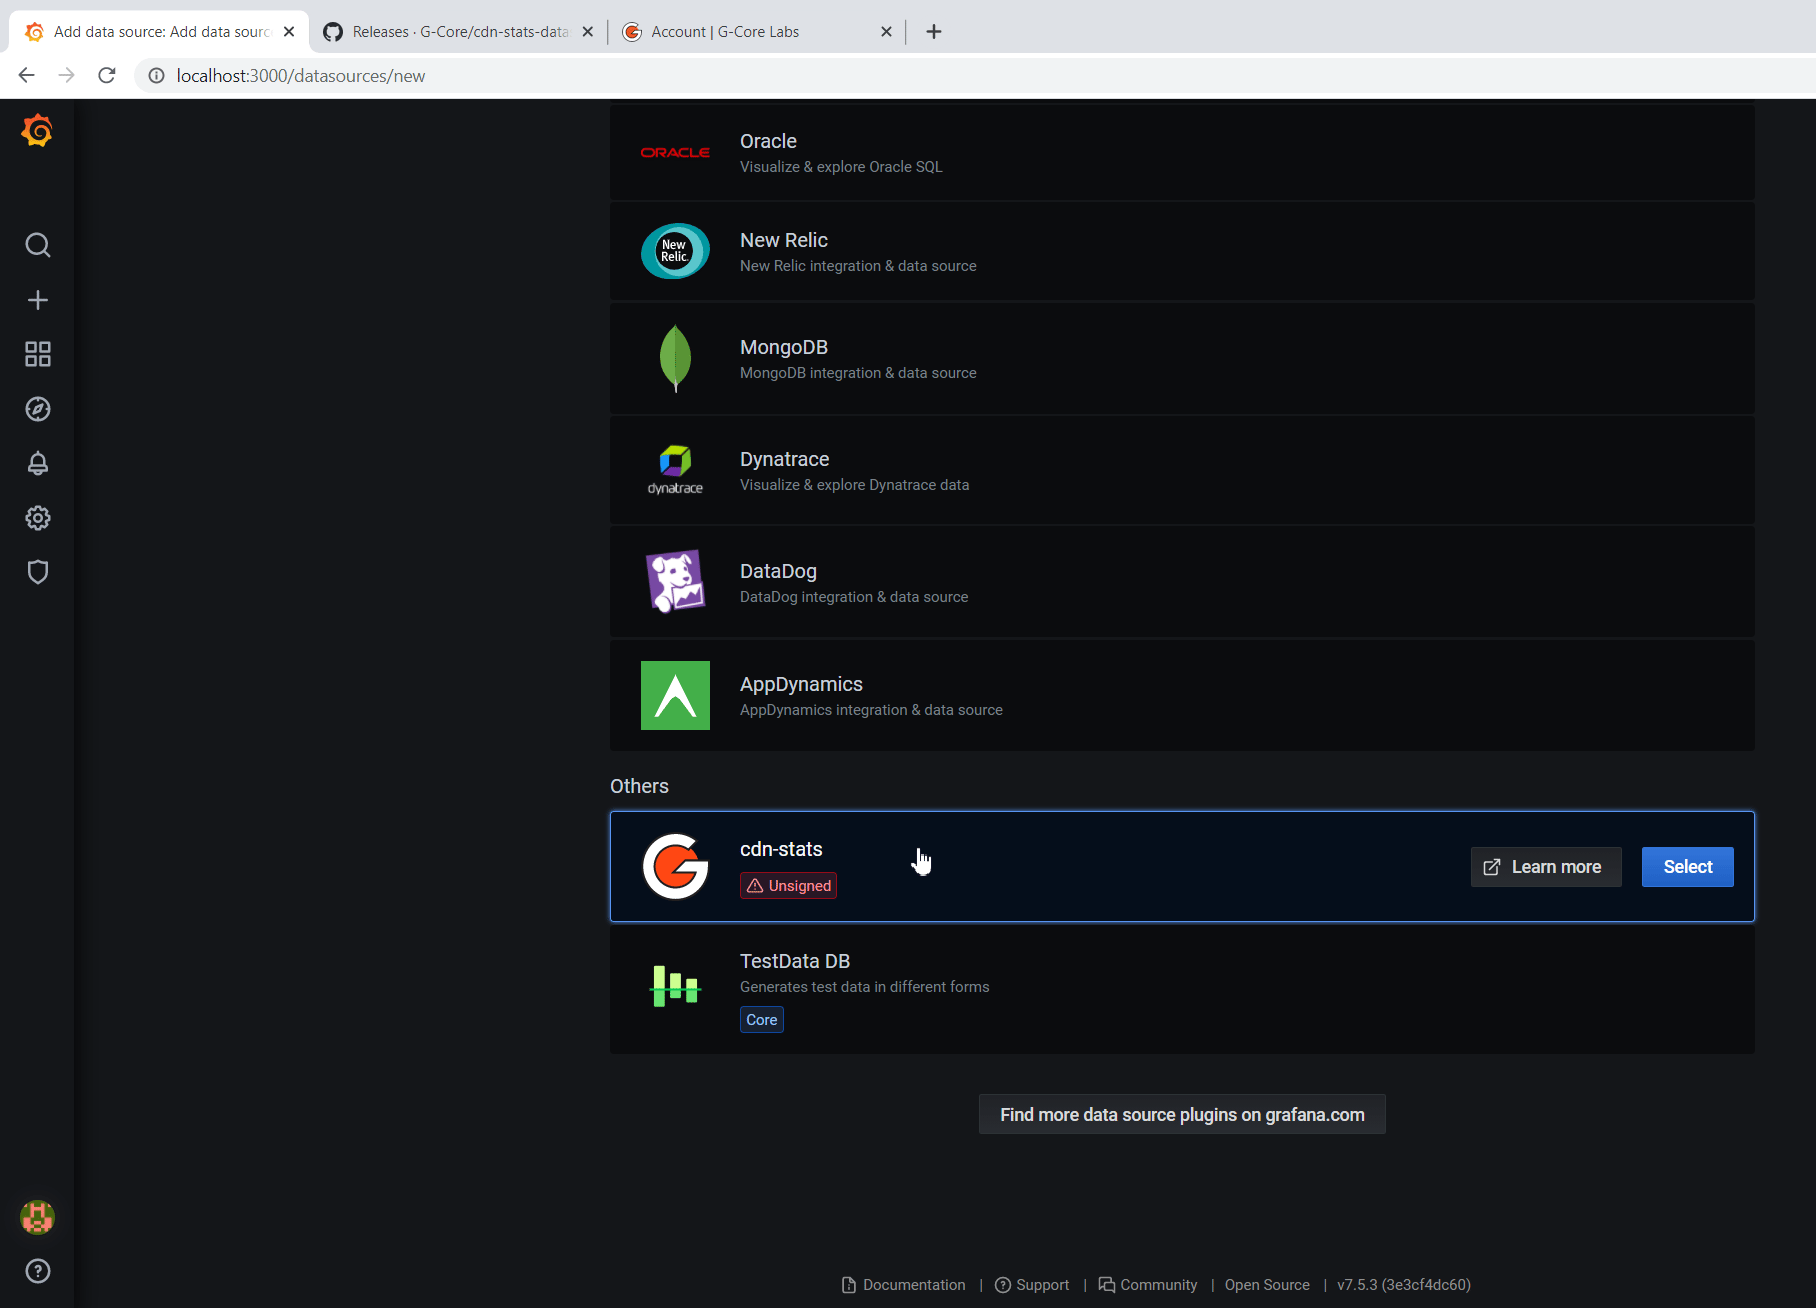
Find the cdn-stats plugin from Gcore and click "Select".
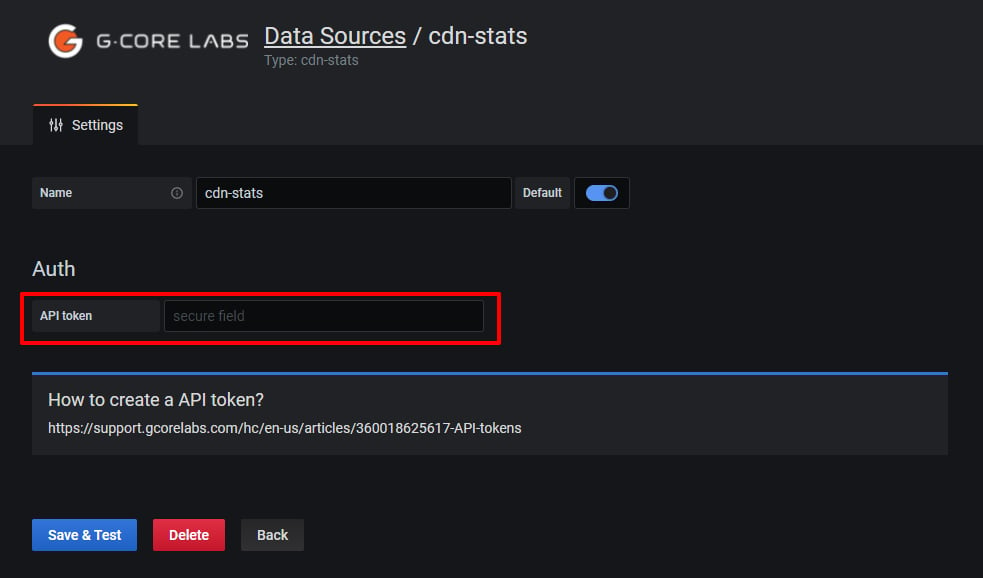
The plugin settings will be opened. Add a permanent API token to the "Auth" section.
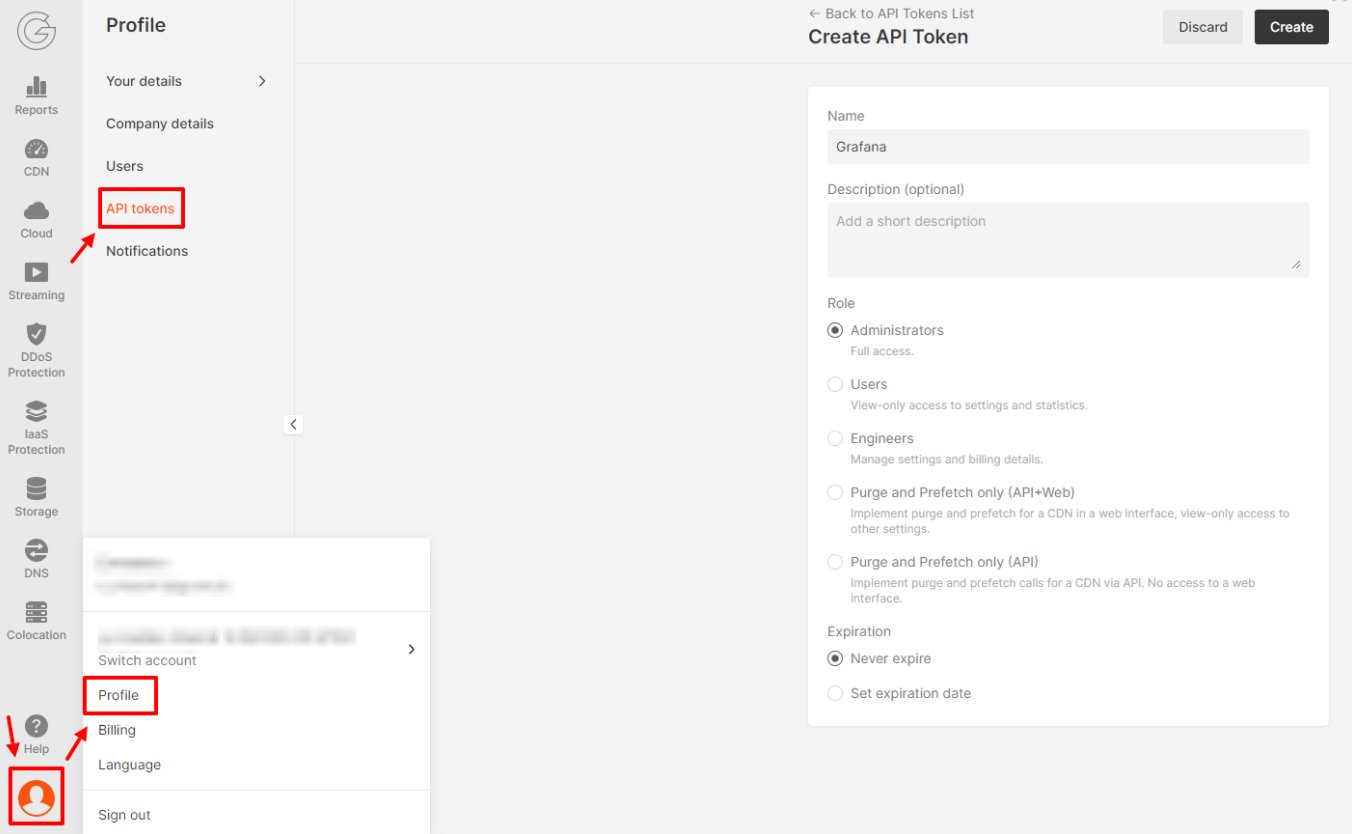
You can get a token in your personal account. To do this, go to Profile > API tokens > Create.
Insert the received API token in the API token field in the format: **APIKey** `{the received API token}`.
For example: `APIKey 7711_eyJ0eXAiOiJKV`
Click **Save & Test**.
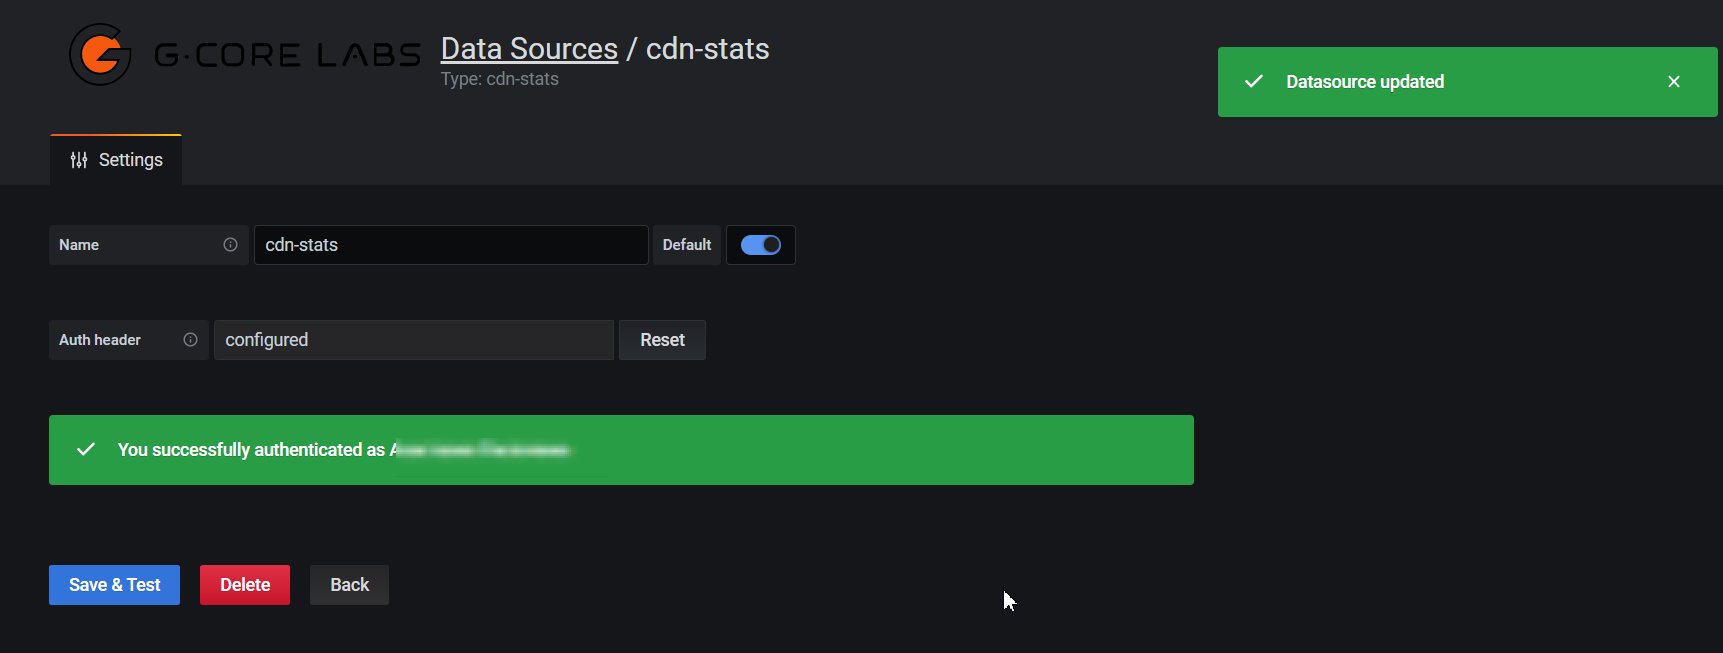
If everything is correct, you will see the following messages: "Datasource updated" and "You successfully authenticated as {Name}".
## The Download and install the plugin step video instructions
## Configure the dashboard
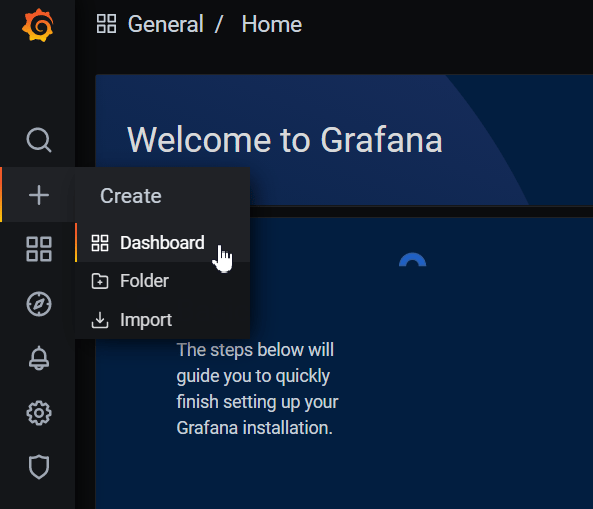
Click on the **+** in the menu to open the "Create" section, select "Dashboard" to add a new dashboard.
In the next window, click "Add an empty panel" to create a new panel.
Make sure that "cdn-stats" is set as the data source in the Query section.
Select the necessary metric, granularity, and grouping (you can select several).
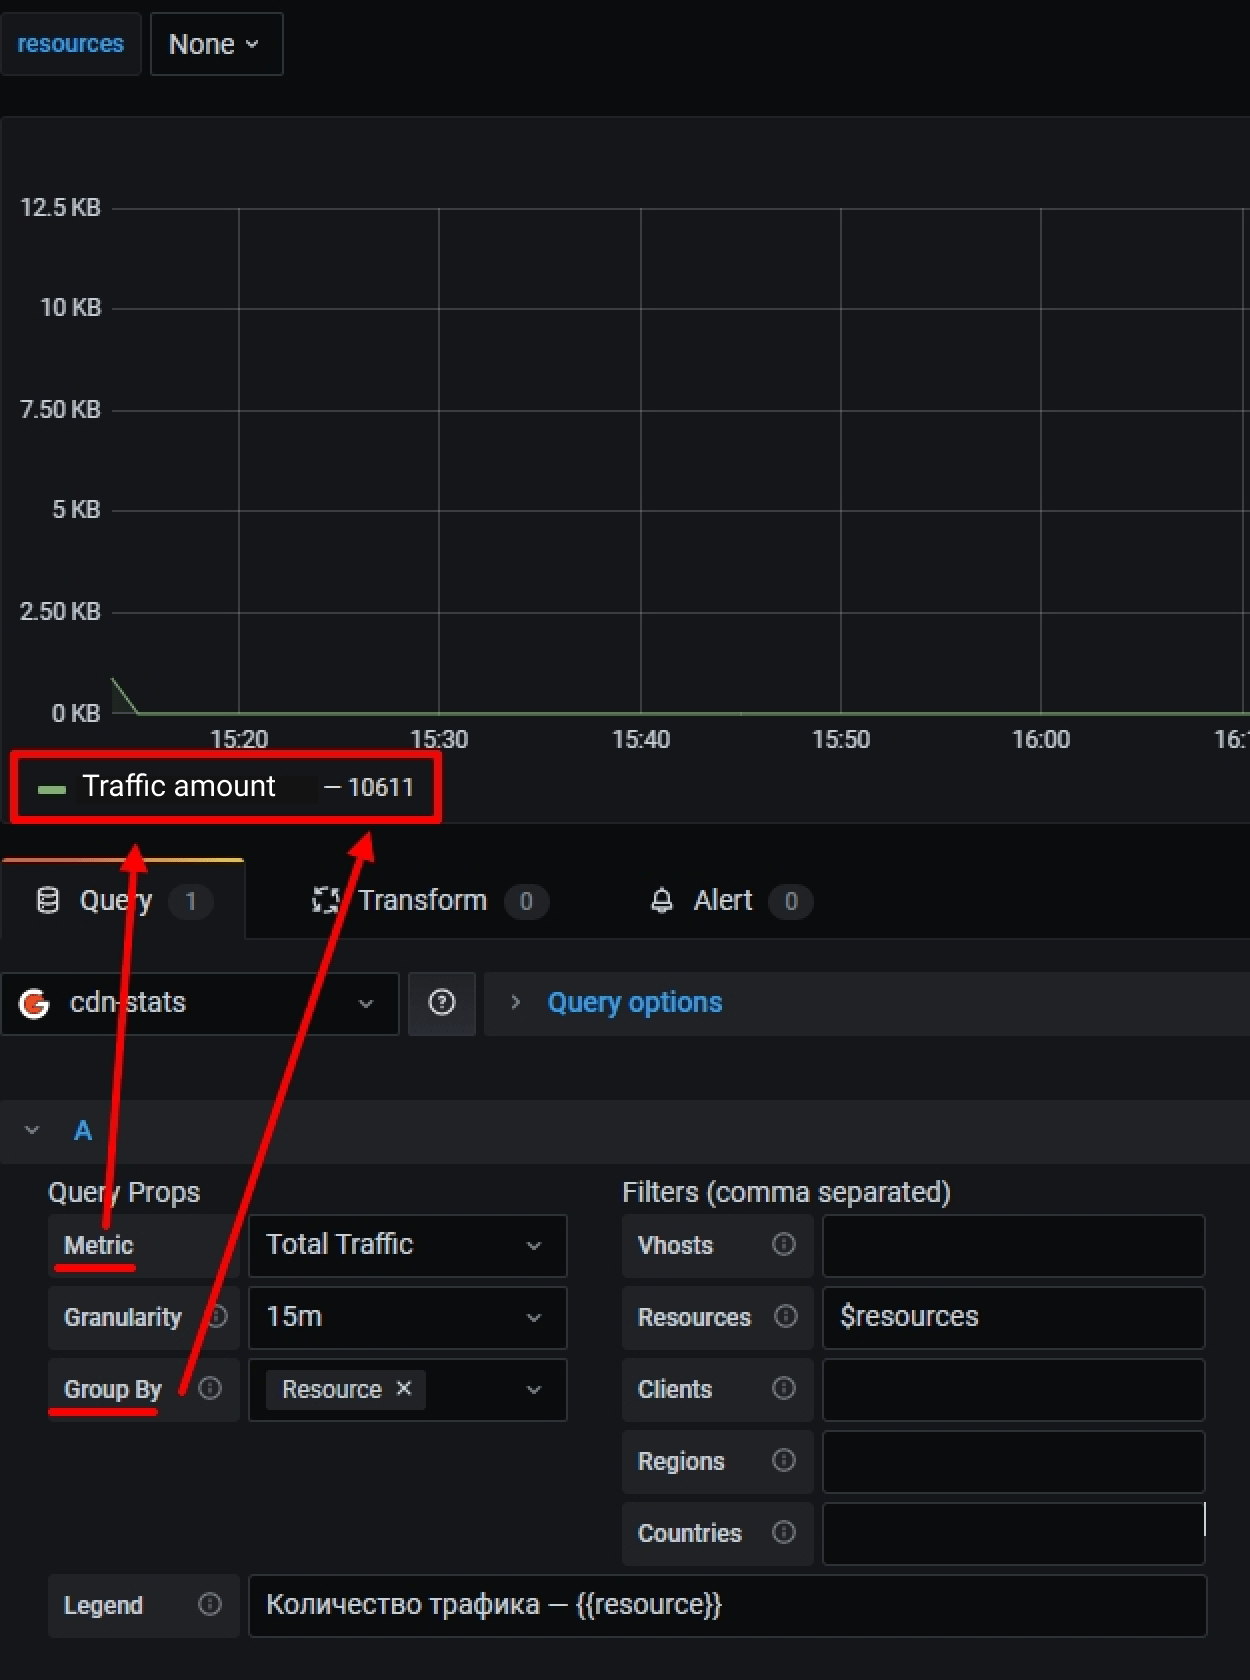
The "Legend" field displays the values of the Group by field and the name of the metric by default:
You can customize the output of legend data.
Set a name for the metric and in brackets `{{}}` set the parameters specified in the Group by field.
For example, for the settings above, you can set the following format: Traffic quantity — `{{resource}}`.
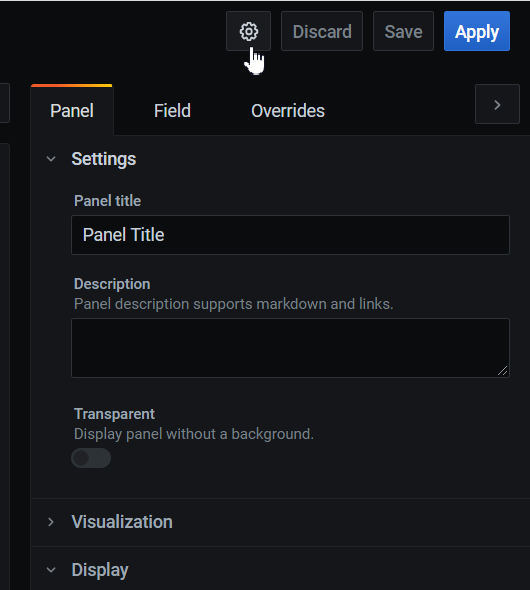
Open the dashboard settings by clicking on the gear icon in the upper-right corner.
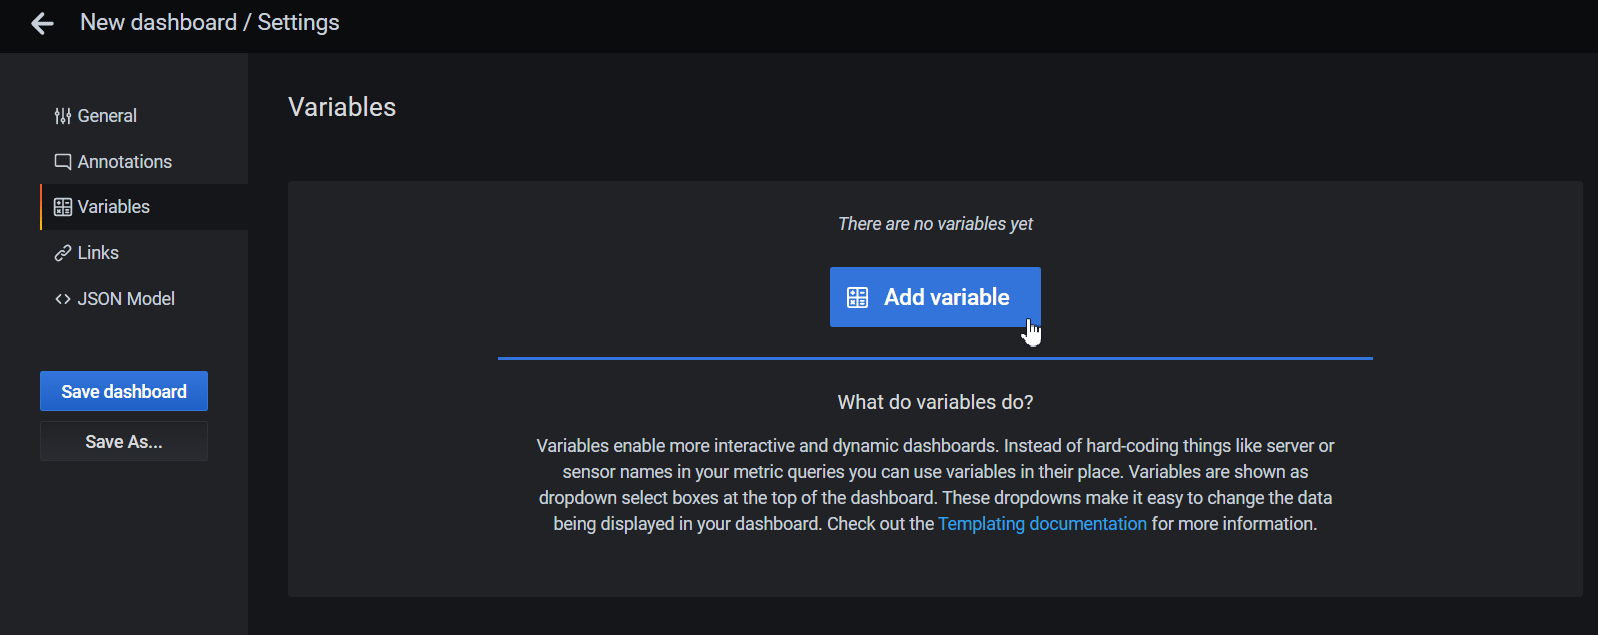
Go to the "Variables" section and click "Add variable". You can use it to filter the data on the chart.
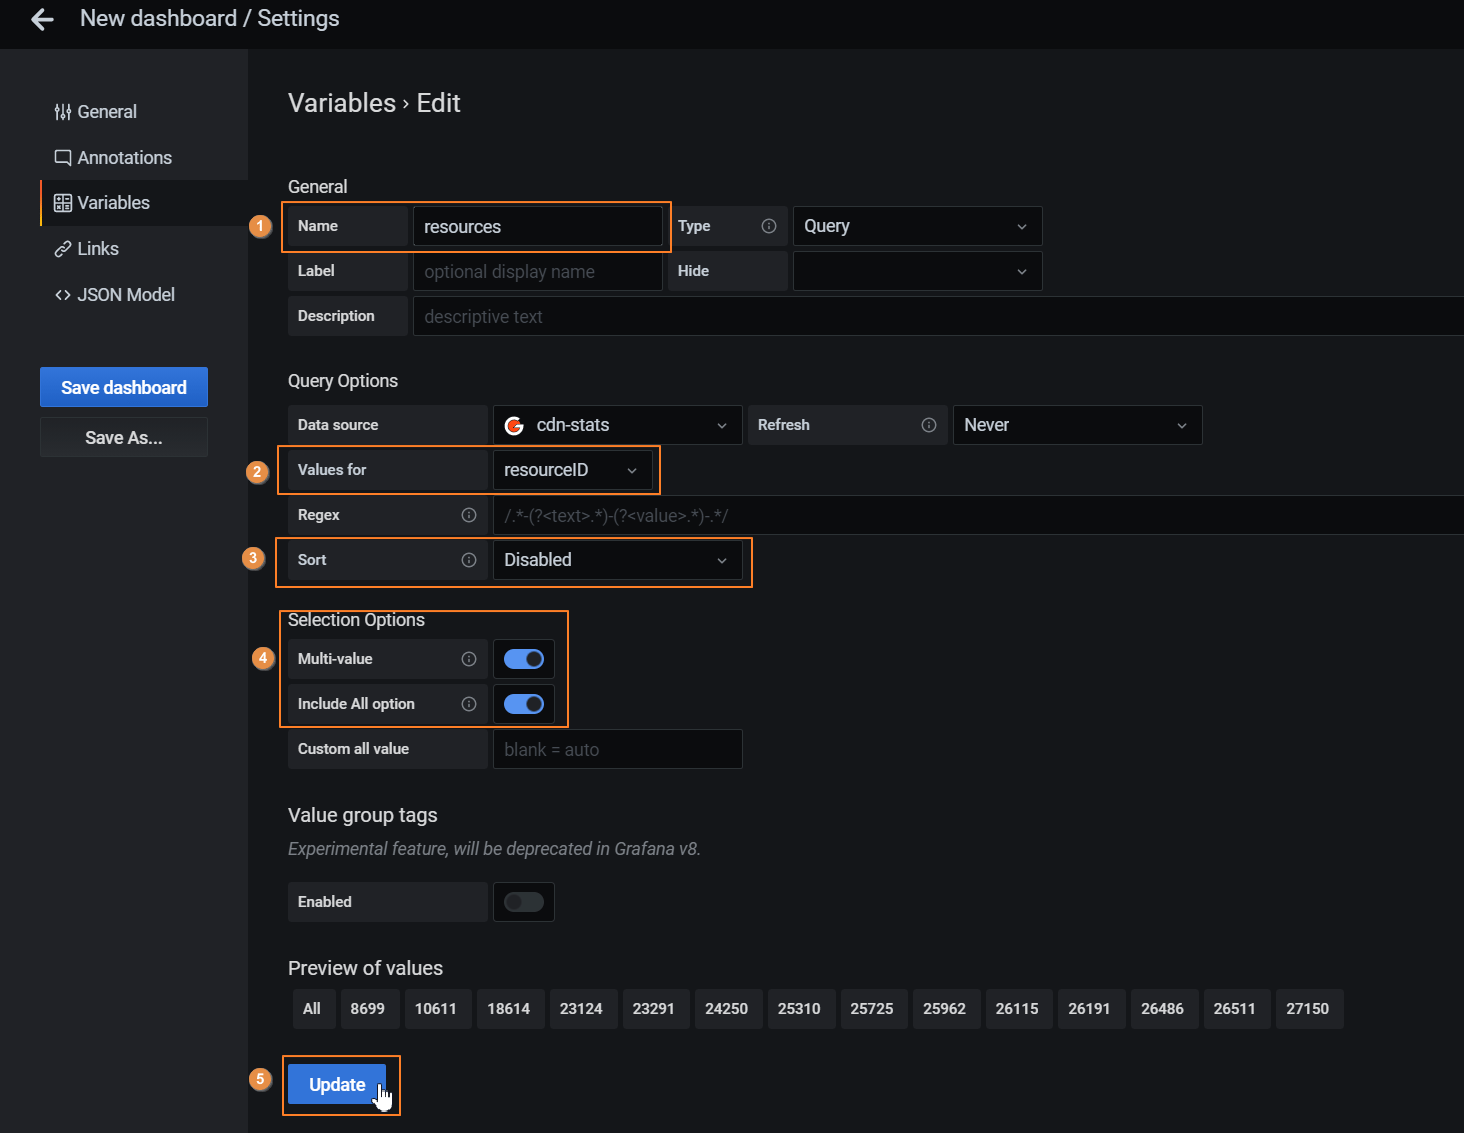
For example, to be able to filter resources, you need to make the following settings and click "Update":
* In the ***Name*** you can specify the variable name (required).
* In the ***Values for*** you can select a value for the variable: resourceID (resources).
* In the ***Sort*** you can set the sorting order of the elements (optional)
* In the ***Selection Options*** you can set the way of how elements can be selected (optional)
* In the ***Multi-value*** you can set the ability to select multiple elements.
* In the ***Include All option*** you can set the ability to select all elements by marking the All value.
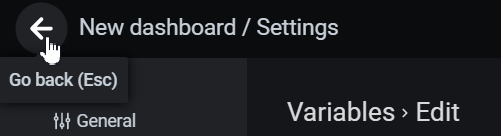
Go back to the dashboard by clicking the arrow icon in the upper-left corner of the screen.
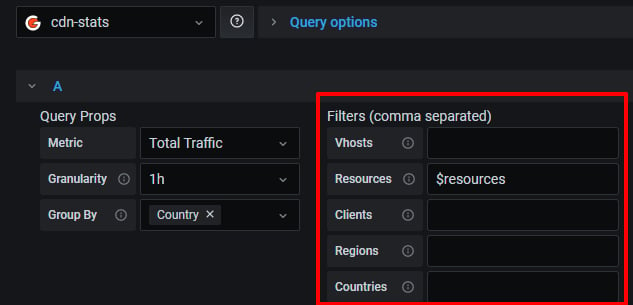
Connect the variable with the Dashboard. To do this, specify its name in the "Resources" field of the "Filters (comma separated)" section.
**Important!** Enter "\$" before the variable name.
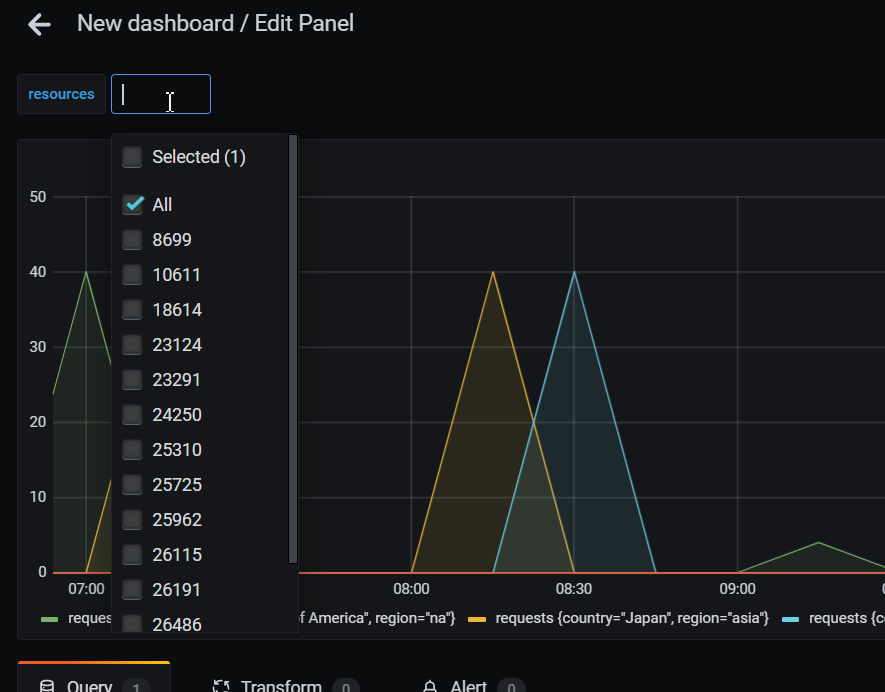
Now you can choose resource data to be displayed on the chart.
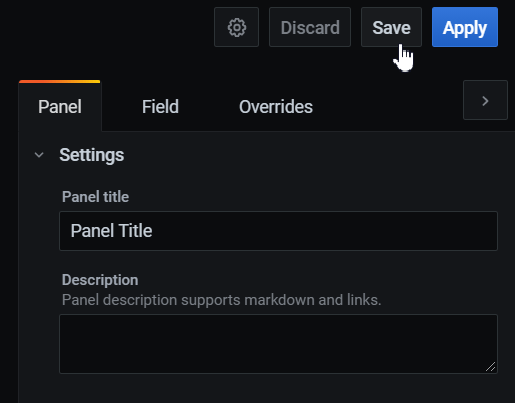
Save the Dashboard. To do this, click "Save" in the upper-right corner of the panel.
## Configure the dashboard step video instructions
 Unzip the archive to the Grafana plugin folder. By default, this is the *Grafana\grafana\data\plugins* installation folder.
[Restart](https://grafana.com/docs/grafana/latest/installation/restart-grafana) and [log](https://grafana.com/docs/grafana/latest/fundamentals/getting-started/first-dashboards/) in to Grafana.
Click the gear icon in the menu to open the "Configuration" section, select "Data Sources".
Unzip the archive to the Grafana plugin folder. By default, this is the *Grafana\grafana\data\plugins* installation folder.
[Restart](https://grafana.com/docs/grafana/latest/installation/restart-grafana) and [log](https://grafana.com/docs/grafana/latest/fundamentals/getting-started/first-dashboards/) in to Grafana.
Click the gear icon in the menu to open the "Configuration" section, select "Data Sources".
 Click **Add data source** to add a new resource for getting data.
 Find the cdn-stats plugin from Gcore and click "Select".
 The plugin settings will be opened. Add a permanent API token to the "Auth" section.
You can get a token in your personal account. To do this, go to Profile > API tokens > Create.
The plugin settings will be opened. Add a permanent API token to the "Auth" section.
You can get a token in your personal account. To do this, go to Profile > API tokens > Create.
 Insert the received API token in the API token field in the format: **APIKey** `{the received API token}`.
For example: `APIKey 7711_eyJ0eXAiOiJKV`
Insert the received API token in the API token field in the format: **APIKey** `{the received API token}`.
For example: `APIKey 7711_eyJ0eXAiOiJKV`
 Click **Save & Test**.
If everything is correct, you will see the following messages: "Datasource updated" and "You successfully authenticated as {Name}".
Click **Save & Test**.
If everything is correct, you will see the following messages: "Datasource updated" and "You successfully authenticated as {Name}".
 ## The Download and install the plugin step video instructions
## Configure the dashboard
Click on the **+** in the menu to open the "Create" section, select "Dashboard" to add a new dashboard.
## The Download and install the plugin step video instructions
## Configure the dashboard
Click on the **+** in the menu to open the "Create" section, select "Dashboard" to add a new dashboard.
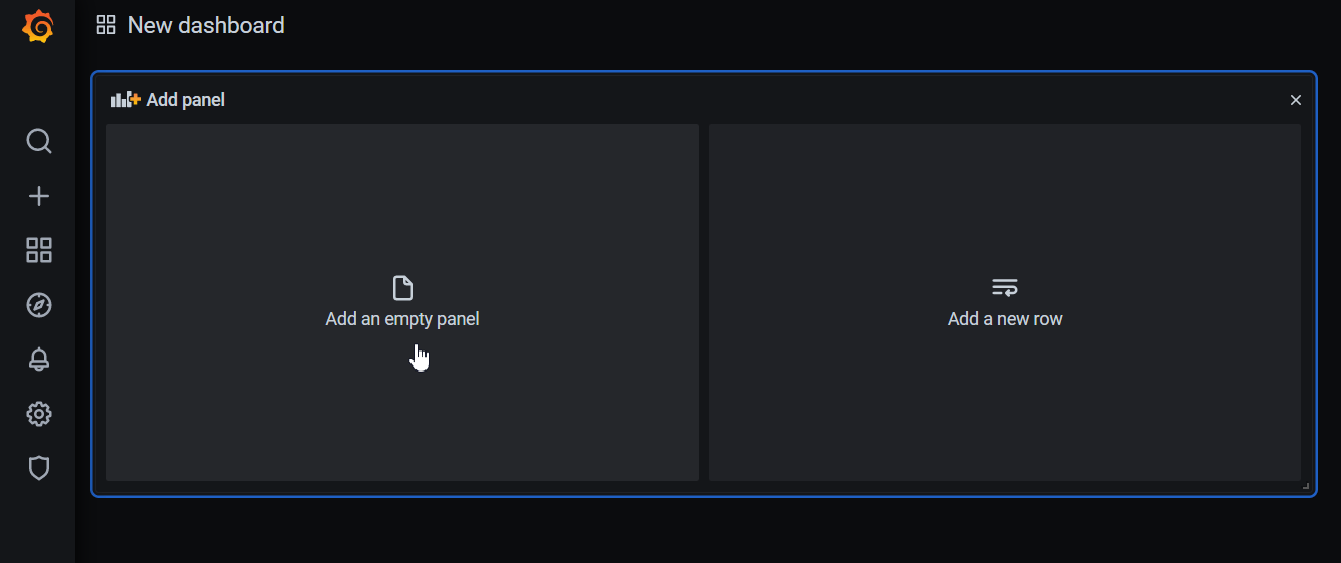
 In the next window, click "Add an empty panel" to create a new panel.
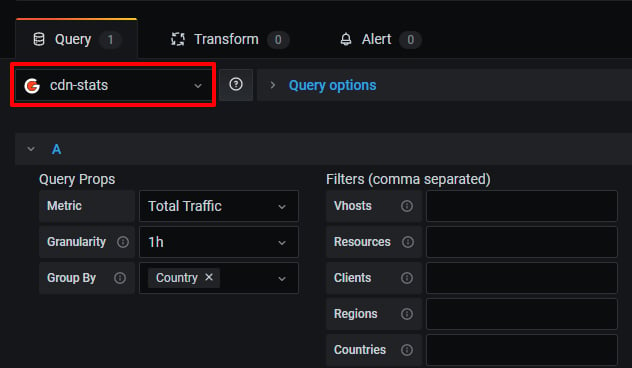
 Make sure that "cdn-stats" is set as the data source in the Query section.
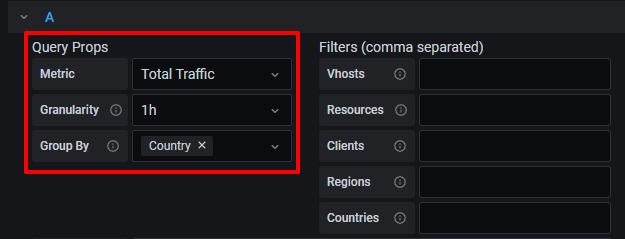
 Select the necessary metric, granularity, and grouping (you can select several).
 The "Legend" field displays the values of the Group by field and the name of the metric by default:
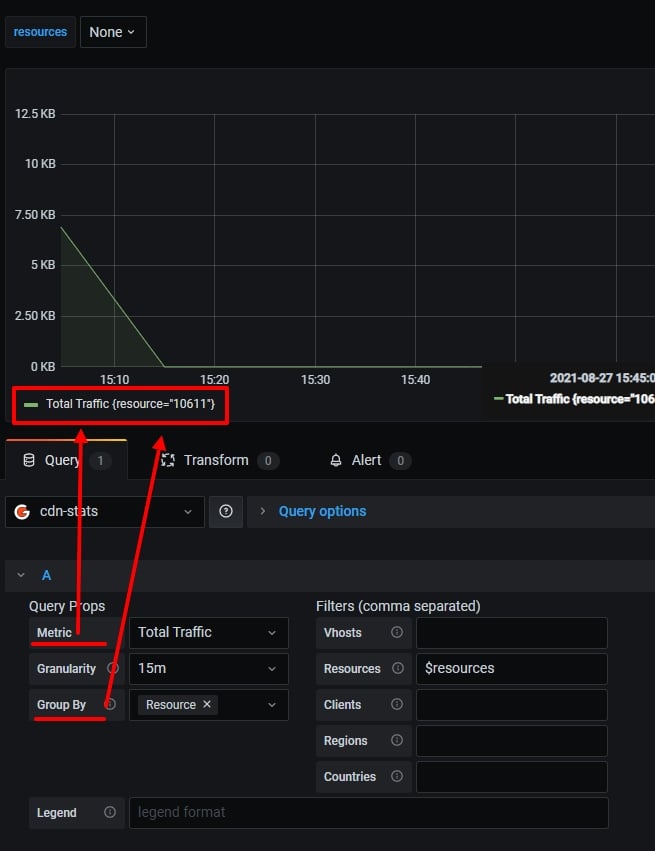 You can customize the output of legend data.
Set a name for the metric and in brackets `{{}}` set the parameters specified in the Group by field.
For example, for the settings above, you can set the following format: Traffic quantity — `{{resource}}`.
You can customize the output of legend data.
Set a name for the metric and in brackets `{{}}` set the parameters specified in the Group by field.
For example, for the settings above, you can set the following format: Traffic quantity — `{{resource}}`.
 Open the dashboard settings by clicking on the gear icon in the upper-right corner.
 Go to the "Variables" section and click "Add variable". You can use it to filter the data on the chart.
 For example, to be able to filter resources, you need to make the following settings and click "Update":
* In the ***Name*** you can specify the variable name (required).
* In the ***Values for*** you can select a value for the variable: resourceID (resources).
* In the ***Sort*** you can set the sorting order of the elements (optional)
* In the ***Selection Options*** you can set the way of how elements can be selected (optional)
* In the ***Multi-value*** you can set the ability to select multiple elements.
* In the ***Include All option*** you can set the ability to select all elements by marking the All value.
For example, to be able to filter resources, you need to make the following settings and click "Update":
* In the ***Name*** you can specify the variable name (required).
* In the ***Values for*** you can select a value for the variable: resourceID (resources).
* In the ***Sort*** you can set the sorting order of the elements (optional)
* In the ***Selection Options*** you can set the way of how elements can be selected (optional)
* In the ***Multi-value*** you can set the ability to select multiple elements.
* In the ***Include All option*** you can set the ability to select all elements by marking the All value.
 Go back to the dashboard by clicking the arrow icon in the upper-left corner of the screen.
 Connect the variable with the Dashboard. To do this, specify its name in the "Resources" field of the "Filters (comma separated)" section.
**Important!** Enter "\$" before the variable name.
Connect the variable with the Dashboard. To do this, specify its name in the "Resources" field of the "Filters (comma separated)" section.
**Important!** Enter "\$" before the variable name.
 Now you can choose resource data to be displayed on the chart.
 Save the Dashboard. To do this, click "Save" in the upper-right corner of the panel.
 ## Configure the dashboard step video instructions